
Account Reporting Insights
This guide walks through the data and sections within an account page so you can quickly find what you need and make informed credit decisions.
Header
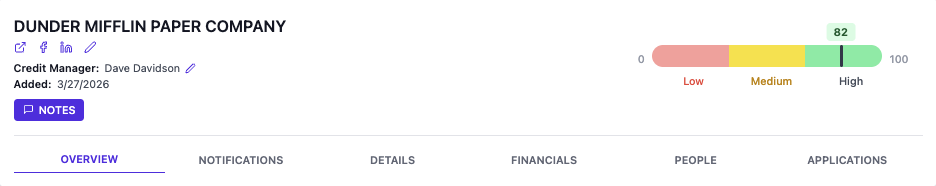
The header is a persistent bar across the account page that gives you a quick snapshot of the business.
It includes company name, Pulse Score, office type, account status, web and social links, credit limit, and recommended credit limit.
You can also assign a Credit Manager to establish ownership and enable filtering across your portfolio.
Overview
The Overview tab is where most day-to-day decisions happen. It combines your credit settings with real-time risk insights.
Start with the Pulse Score for a quick view of overall risk. Use the Health Score to assess long-term stability and the Payment Score to understand near-term payment behavior.
Update Credit Settings to reflect your final decision. For additional context, use Scout by clicking the sparkle icon or opening a chat.
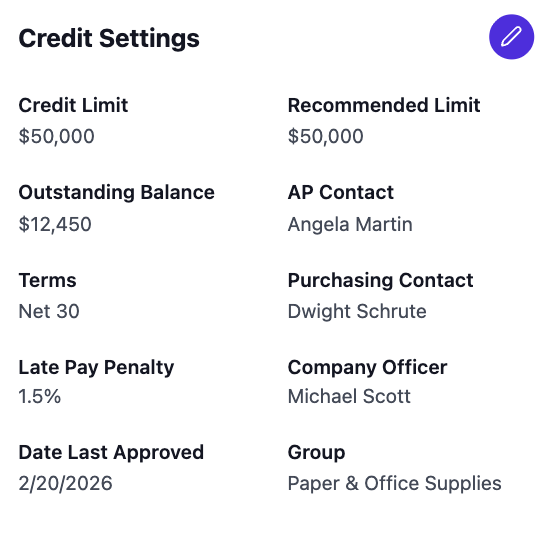
Credit Settings
Update credit limits and terms based on your agreement with the customer.
Click the edit icon to make changes so your system reflects how you actually extend credit, not just recommendations.
Risk Scores
This section provides a predictive view of customer risk using machine learning models trained on real-world outcomes like bankruptcies and payment behavior.
Each score helps answer a different question so you can make faster, more consistent decisions.
Learn more about our Risk Scoring Models >>
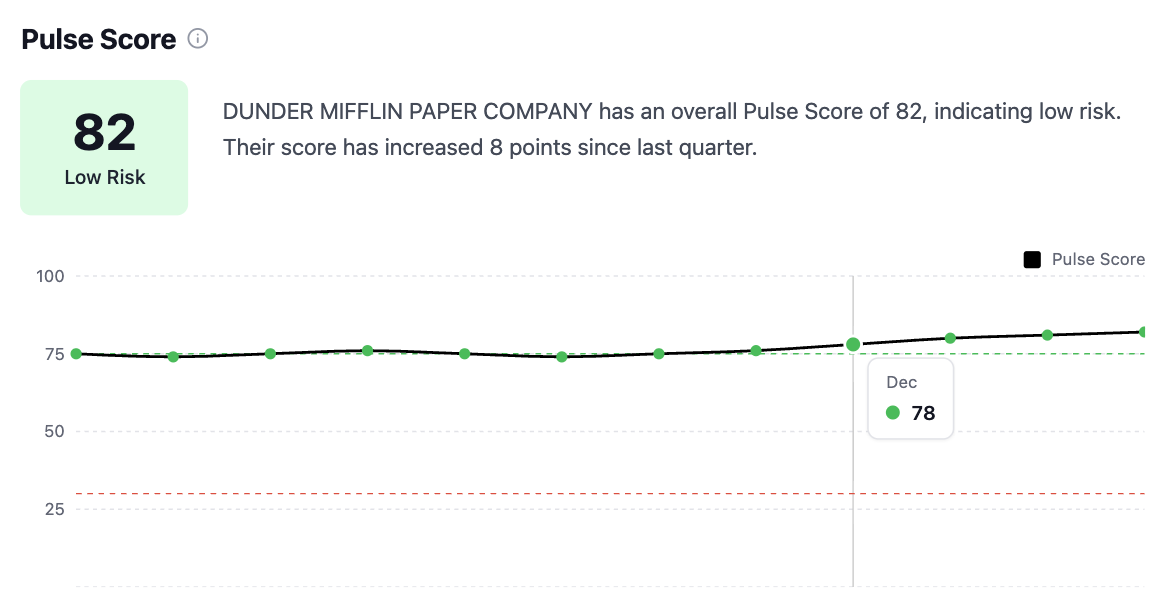
Pulse Score
The Pulse Score provides a high-level view of overall risk. It includes the current score and a historical trend. Hover over the chart to see how risk has changed over time.
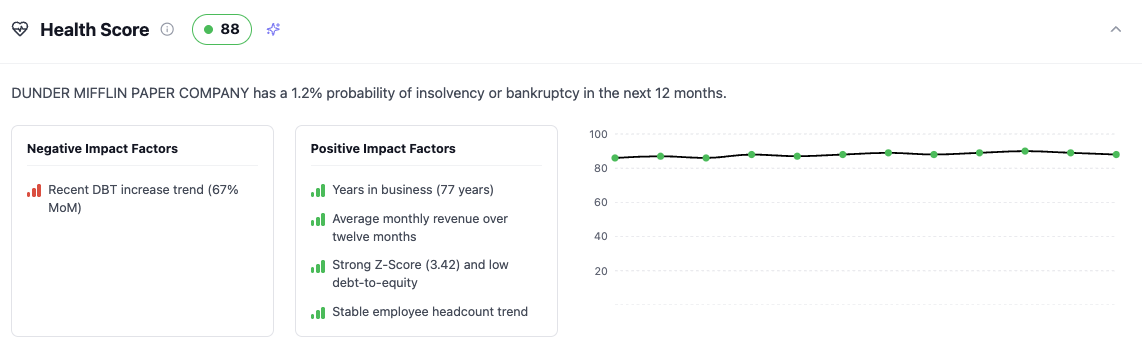
Health Score
The Health Score measures long-term financial stability and likelihood of bankruptcy within the next 12 months. It includes trend data and key positive and negative factors driving the score.
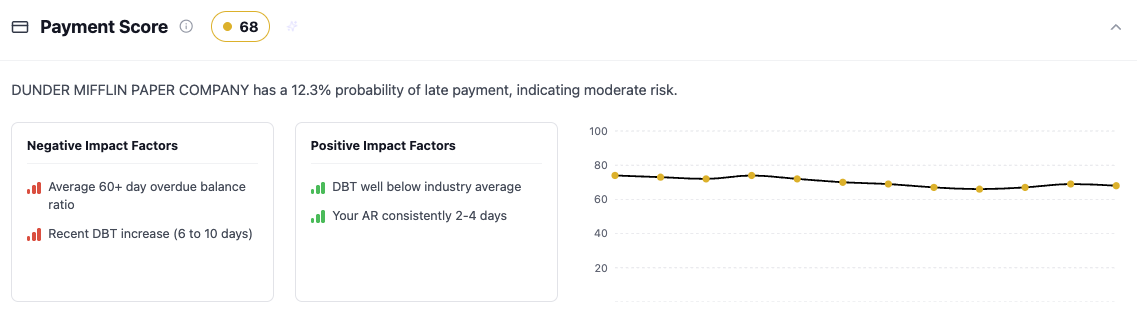
Payment Score
The Payment Score predicts how likely a customer is to pay late. It includes historical trends and contributing factors to help explain changes in behavior.
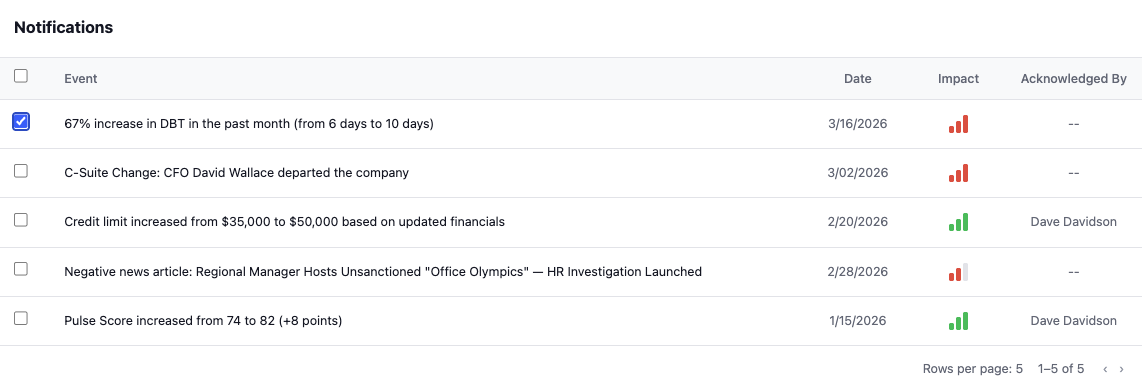
Notifications
The Notifications section shows recent changes and events in a single timeline.
It helps you understand what changed, when it happened, and the level of impact. You can also see whether a notification has been acknowledged and by whom.
Use this section to monitor activity such as payment behavior changes, score updates, company events, and credit updates. You can also see whether a notification has been acknowledged and by whom.
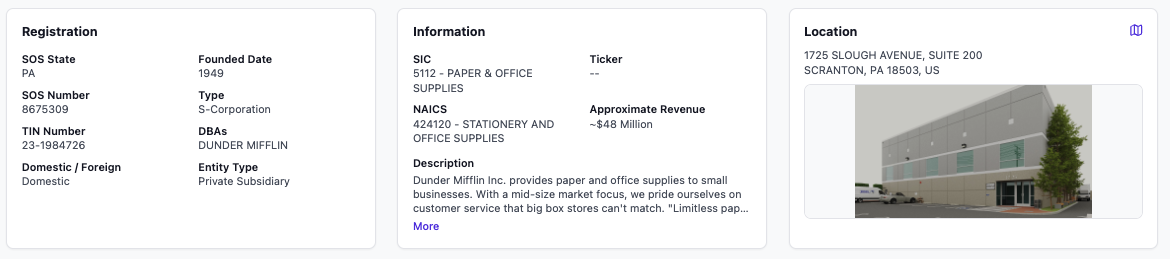
Details
This section provides key company information and firmographic data to help you understand who you’re doing business with.
Registration
Displays official company registration details such as legal identifiers, entity type, and incorporation information.
Information
Includes firmographic data like industry classification, revenue estimates, and business description.
Location
Shows the company’s primary address. You can use the map icon to view the location in street view for additional verification.
Legal Filings
The Legal Filings section shows public records tied to a company’s legal and financial obligations. You can use the filters to view specific types.
Lawsuits show legal disputes involving the company. These can point to operational or financial issues depending on how frequent or severe they are.
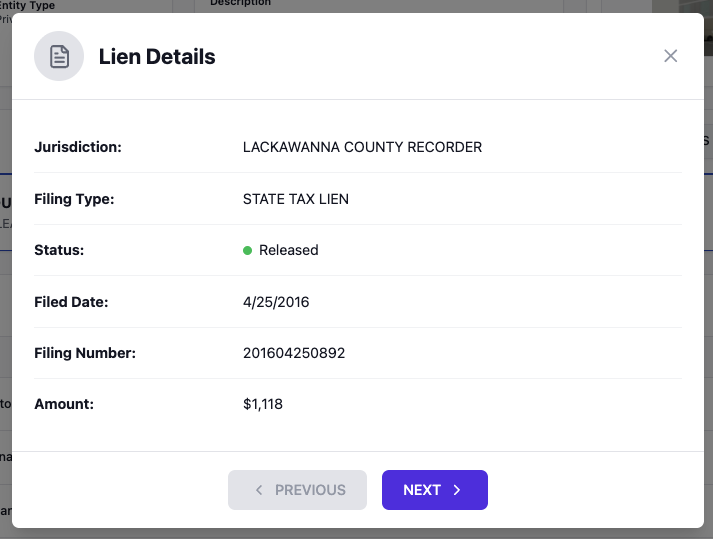
Liens are claims placed on a company’s assets due to unpaid obligations, such as taxes or vendor balances. This can signal payment risk and may impact your ability to collect.
UCC Filings indicate that a lender has a secured interest in the company’s assets. This helps you understand existing debt and where you may fall in priority if something goes wrong.
Bankruptcy filings show when a company has sought legal protection from creditors. This is one of the strongest indicators of financial distress and elevated risk.
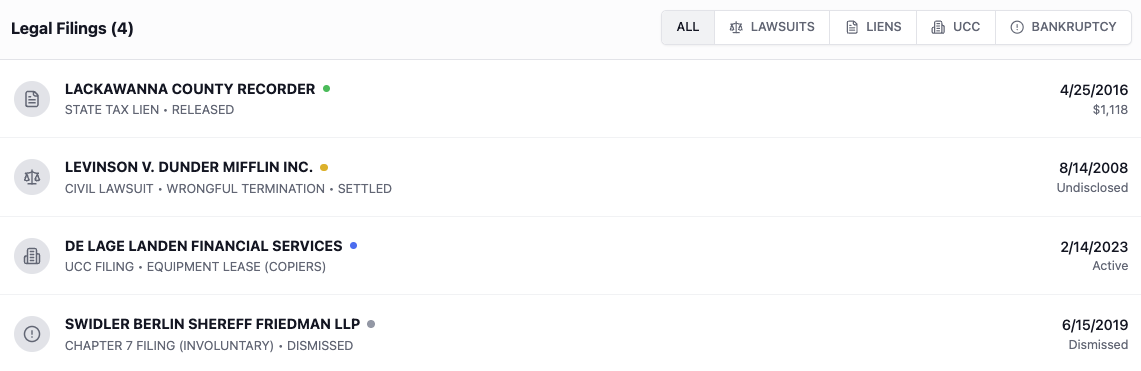
Click into any filing to view additional details, including status, dates, amounts, and related parties when available. This helps you understand the full context behind each record, not just the headline.
News
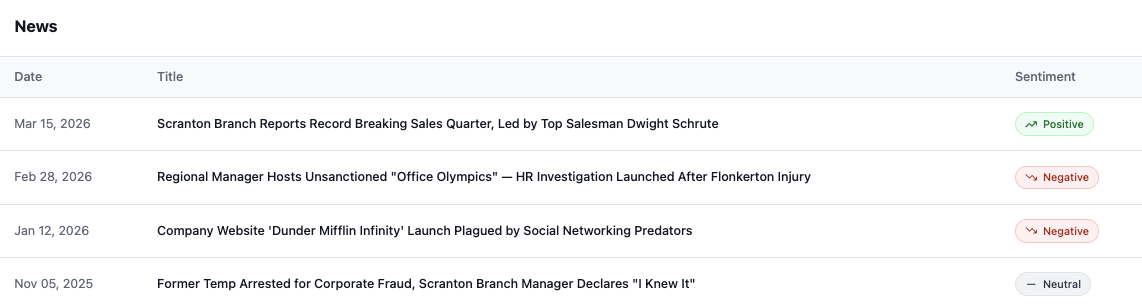
The News section shows recent media coverage related to the company.
Articles include date, headline, and sentiment, and can be opened to view the full source. Use this to understand external events that may impact risk.
Use this section to quickly understand external events that may impact a customer’s risk, such as leadership changes, operational issues, or positive business momentum.
Affiliated Companies
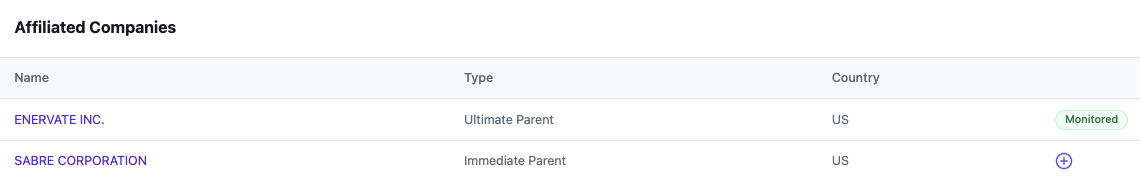
This section shows related entities such as parent companies and subsidiaries.
Each entry includes relationship type and country. Use the "+" icon to add a company to your portfolio and expand monitoring. Companies you are already monitoring will be listed as such in this section.
Branch Offices
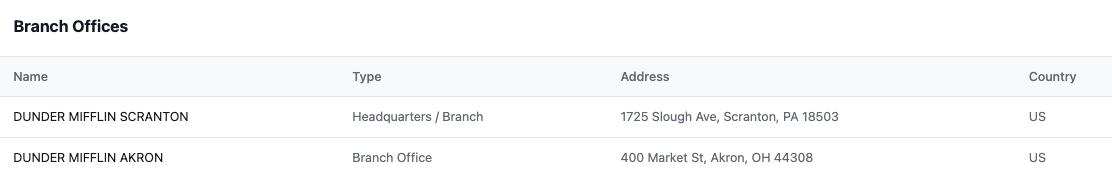
The Branch Offices section lists known locations associated with the company. Each entry includes the office name, type, address, and country so you can understand where the business operates.
Use this section to verify operational presence, identify geographic footprint, and spot differences between headquarters and branch locations.
Financials
This section includes insights from financial statements, card revenue, and trade payment behavior.
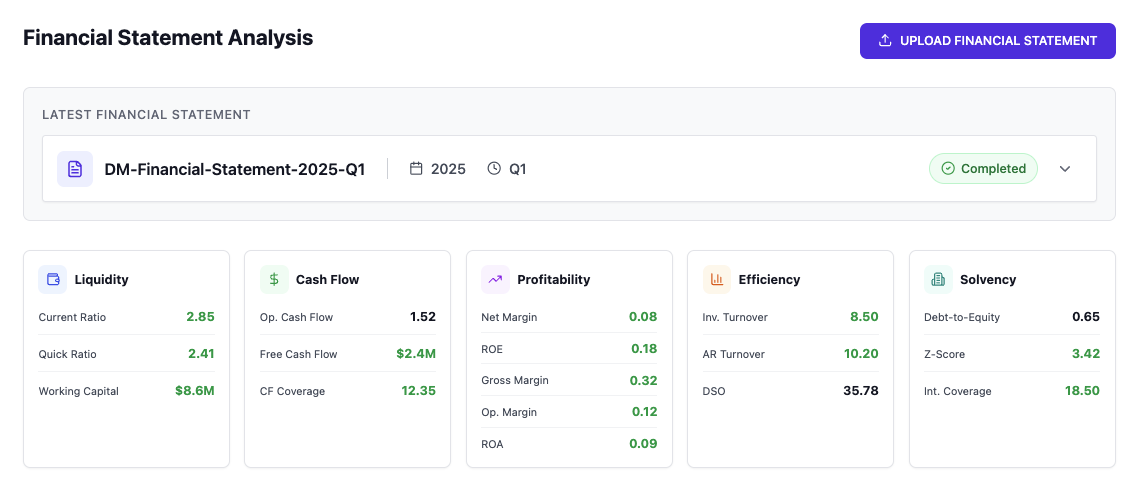
Financial Statement Analysis
For public companies, financials are automatically captured and spread to provide financial ratios as new statements are published.
For private companies, you can upload statements to generate insights across liquidity, cash flow, profitability, efficiency, and solvency.
The most recent statement appears first, with the ability to view past entries for trend analysis.
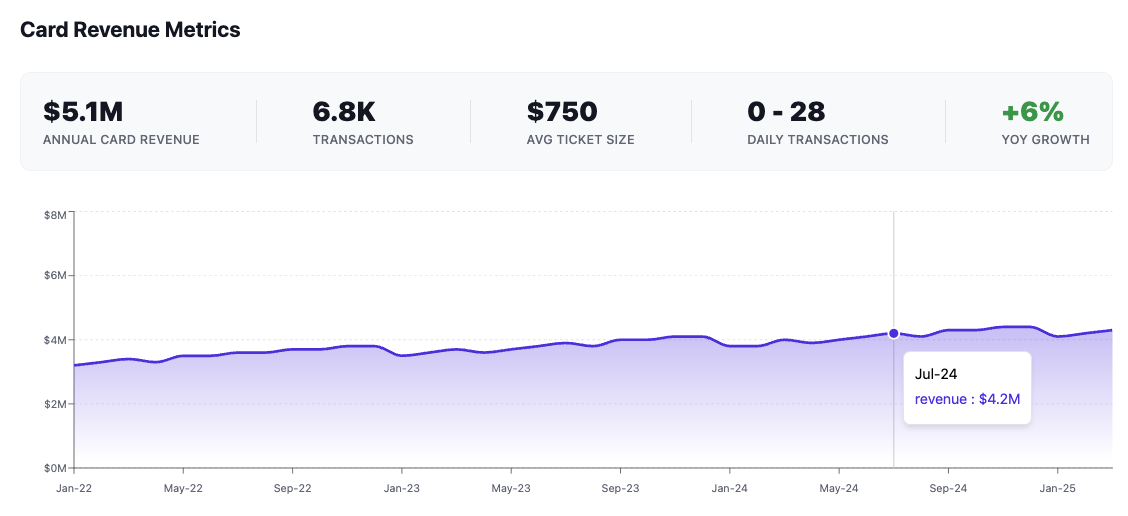
Card Revenue Insights
This section shows estimated credit & debit card revenue and transaction activity.
Metrics include revenue, transactions, ticket size, and growth. The chart shows historical trends over time. Hover to view detailed values.
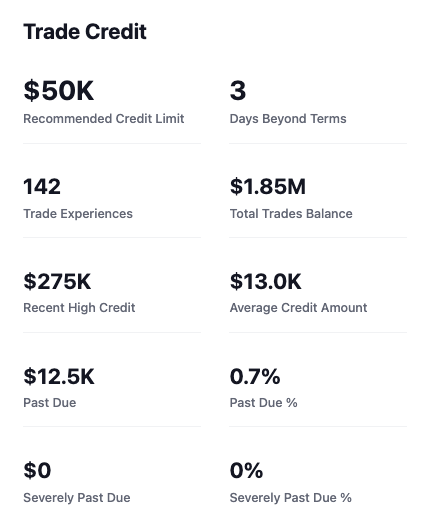
Trade Credit Insights
This section provides visibility into a company’s trade payment behavior and credit exposure.
Key metrics include recommended credit limit, days beyond terms (DBT), number of trade experiences, and total trade balance. These help you understand how the company is performing with other vendors and how much credit they are currently utilizing.
Use this section to assess payment reliability, benchmark behavior against your terms, and validate credit decisions.
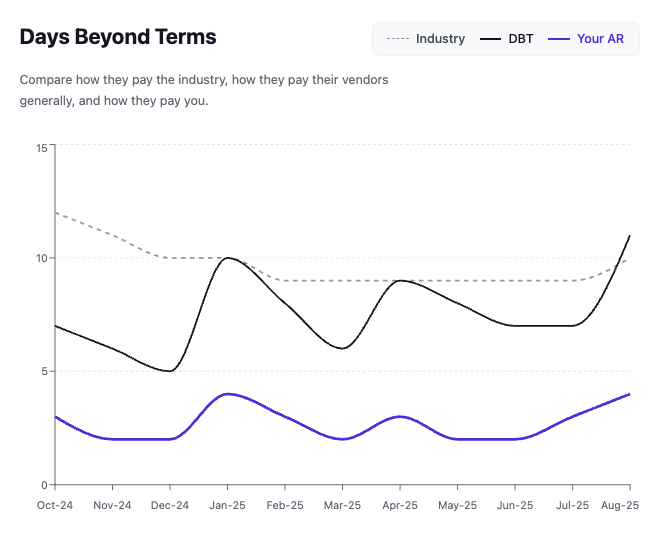
Days Beyond Terms Insights
This section provides a view of historical payment behavior over time.
The chart shows how a customer’s Days Beyond Terms (DBT) compares to industry averages and, when available, how they pay you directly.
Hover over the chart to see detailed values for each time period and identify trends or changes in payment behavior.
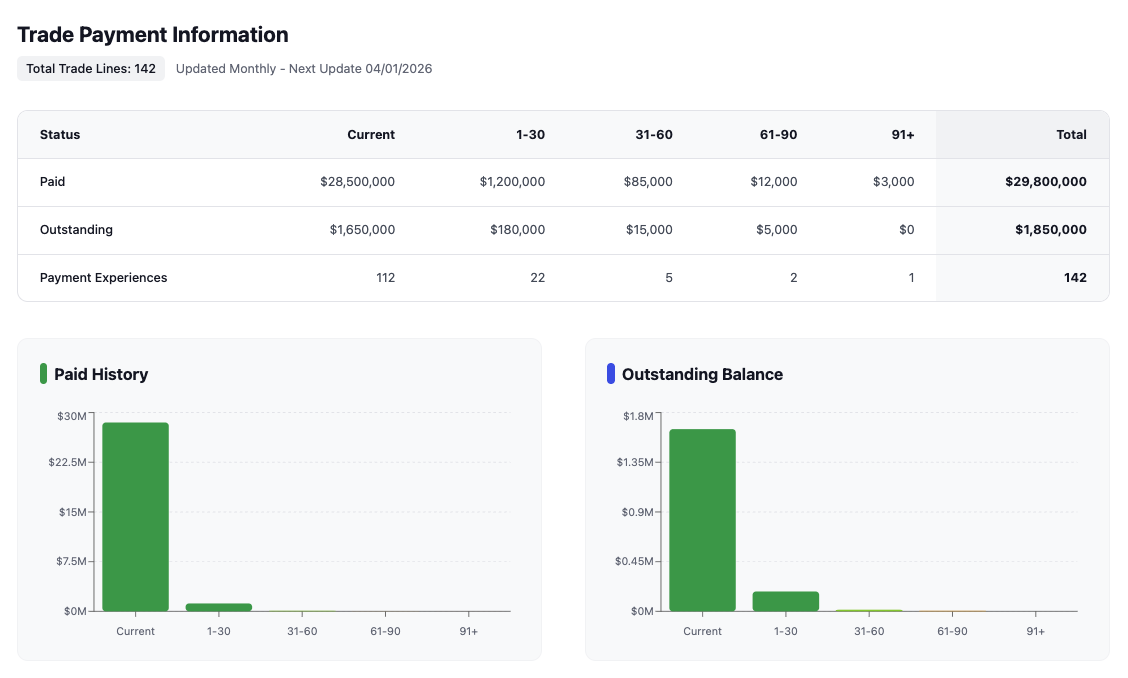
Trade Payment Information
This section shows a company’s trade payment activity, updated monthly.
It includes a breakdown of balances by aging buckets, along with total paid, outstanding amounts, and number of payment experiences. This helps you understand how the company is paying across all vendors.
You’ll also see visual summaries of paid history and outstanding balances to quickly identify trends and concentration in specific aging categories.
Use this section to assess payment consistency, spot early signs of delay, and compare current behavior to historical patterns.
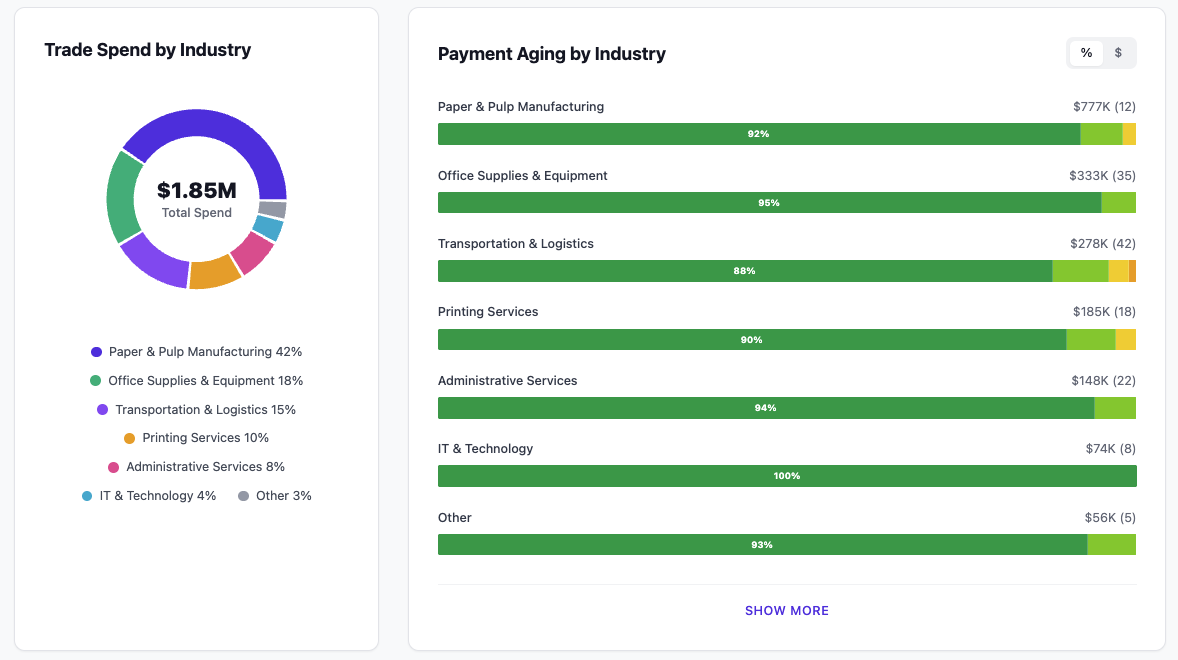
Trade Spend by Industry
This section shows how a company’s trade activity is distributed across different industries.
The chart breaks down total spend by industry, helping you understand where the company is most active. The payment aging view shows how those balances are being paid within each industry, including how much is current versus overdue.
Use this section to identify concentration risk, understand key supplier categories, and spot differences in payment behavior across industries.
People
This section provides insights into a company’s workforce and leadership, including headcount, employee trends, and company principals.
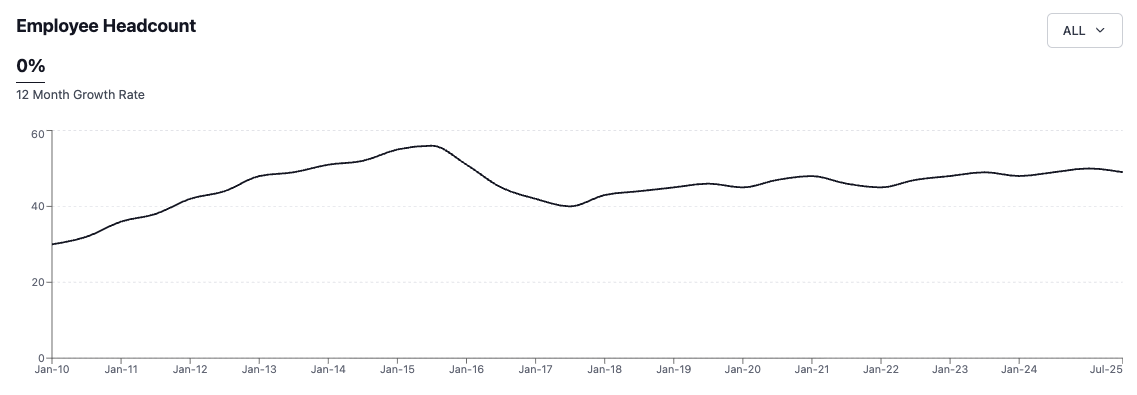
Headcount Trends
The headcount chart shows how a company’s employee count has changed over time.
You can adjust the time range to view shorter periods. Hover over the chart to see specific data points and trends. Key metrics, such as 12-month growth rate, are also included to help you understand whether the company is expanding, stable, or contracting.
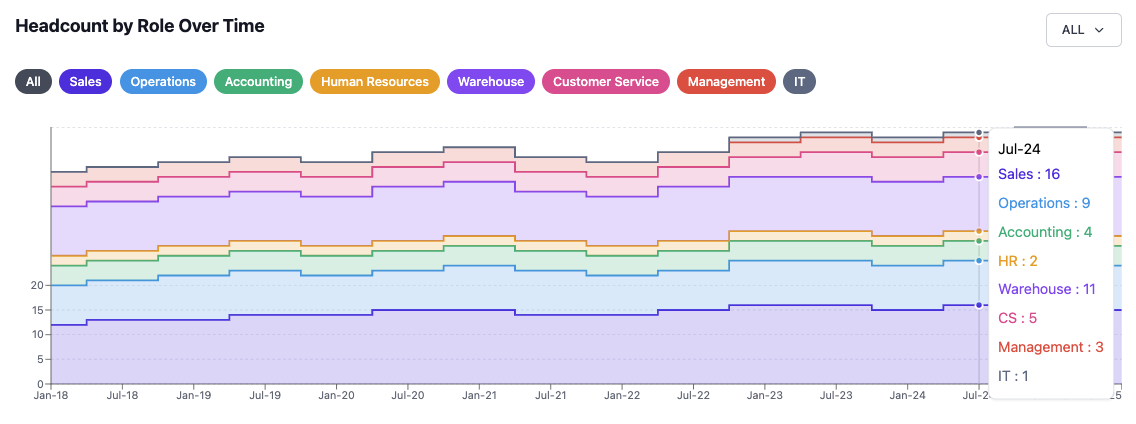
Headcount by Role or Department Over Time
This section shows how a company’s employee count has changed over time across specific leadership levels, roles, or departments.
You’ll see two views: one breaking down headcount by role or level, and another by department. These help you understand where growth or reductions are happening within the organization.
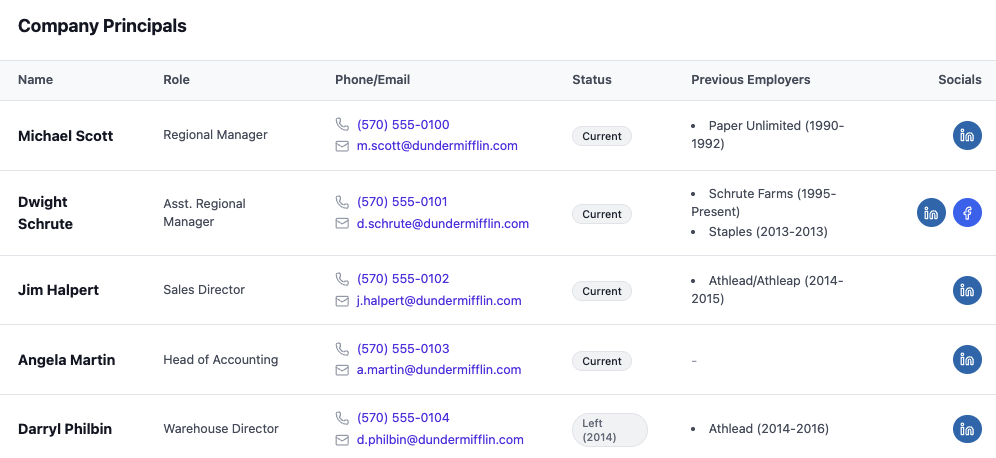
Company Principals
This section lists key individuals associated with the company, including leadership and other notable roles.
For each person, you’ll see their role, contact information (when available), employment status, and previous employers. Social links may also be included.
Use this section to identify decision-makers, verify contacts, and understand leadership experience and turnover.
Questions? Email support@creditpulse.com to reach out team.