
Risk Scoring Models
How Credit Pulse scores risk and how to interpret each score in your workflow.
Our scoring models are built using machine learning trained on thousands of companies. They analyze real-world outcomes such as bankruptcies and payment behavior to predict future risk.
Each score ranges from 0 to 100 and is relative, meaning it ranks a company compared to others in our dataset.
High Risk = 0 - 30
Moderate Risk = 31-70
Low Risk = 71-100
Scoring Overview
Each score answers a different question:
Pulse Score → Overall risk
Health Score → Likelihood of failure
Payment Score → Likelihood of paying late
Used together, they give you a more complete picture:
High Health + Low Payment = stable but slow payer
Low Health + High Payment = paying now, but risk ahead
Low across all = high-risk account
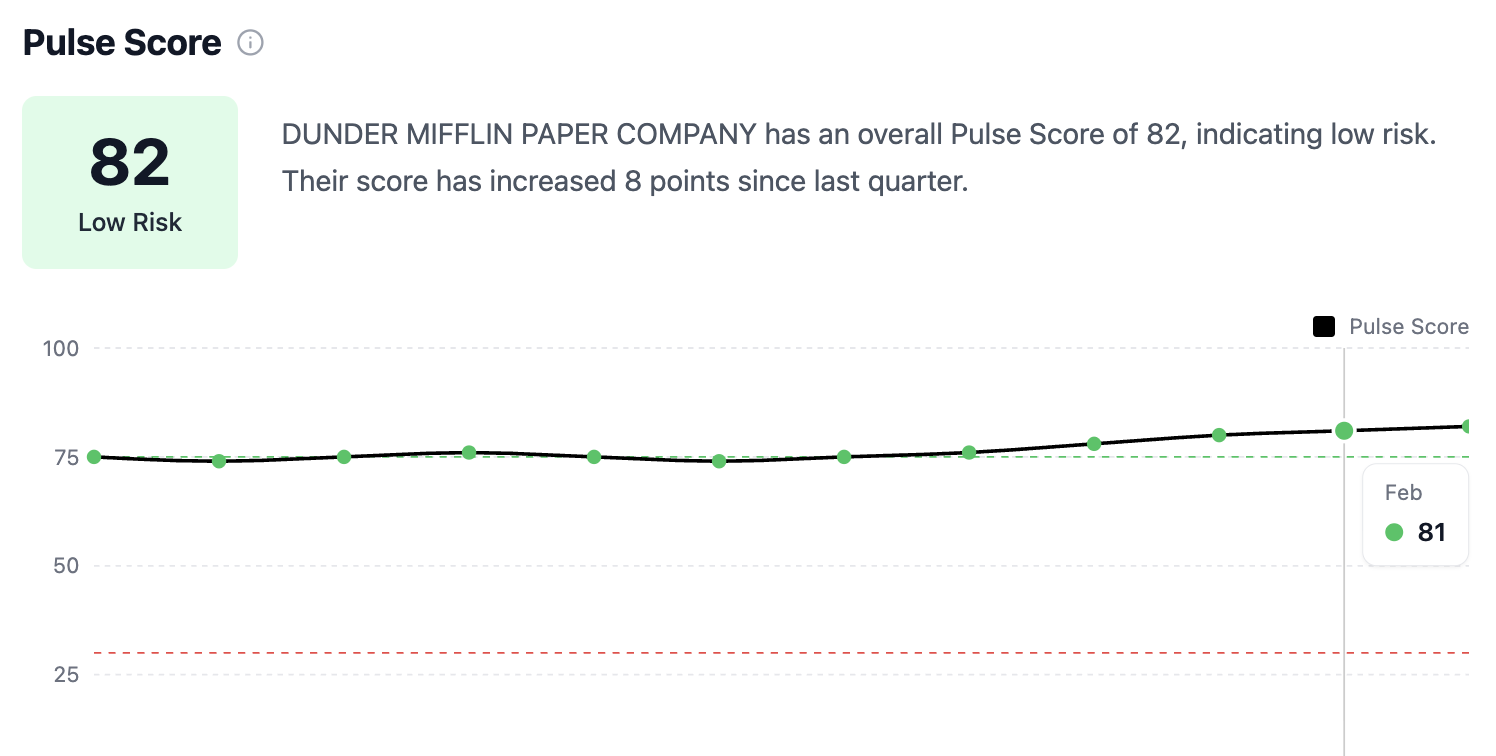
Pulse Score
The Pulse Score is our highest-level risk indicator. It gives you a single, comprehensive view of a company’s overall risk.
It combines multiple data sources and signals into one score so you can make quick decisions without digging through fragmented data.
What it considers:
Bankruptcy risk signals
Payment behavior
Company stability and activity
Financial and operational indicators
Alternative data (news, hiring trends, etc.)
How to use it:
Use as your primary decisioning score
Ideal for quick approvals, declines, or prioritization
Best starting point before diving deeper into details
Think of Pulse Score as your “should I extend credit?” shortcut.
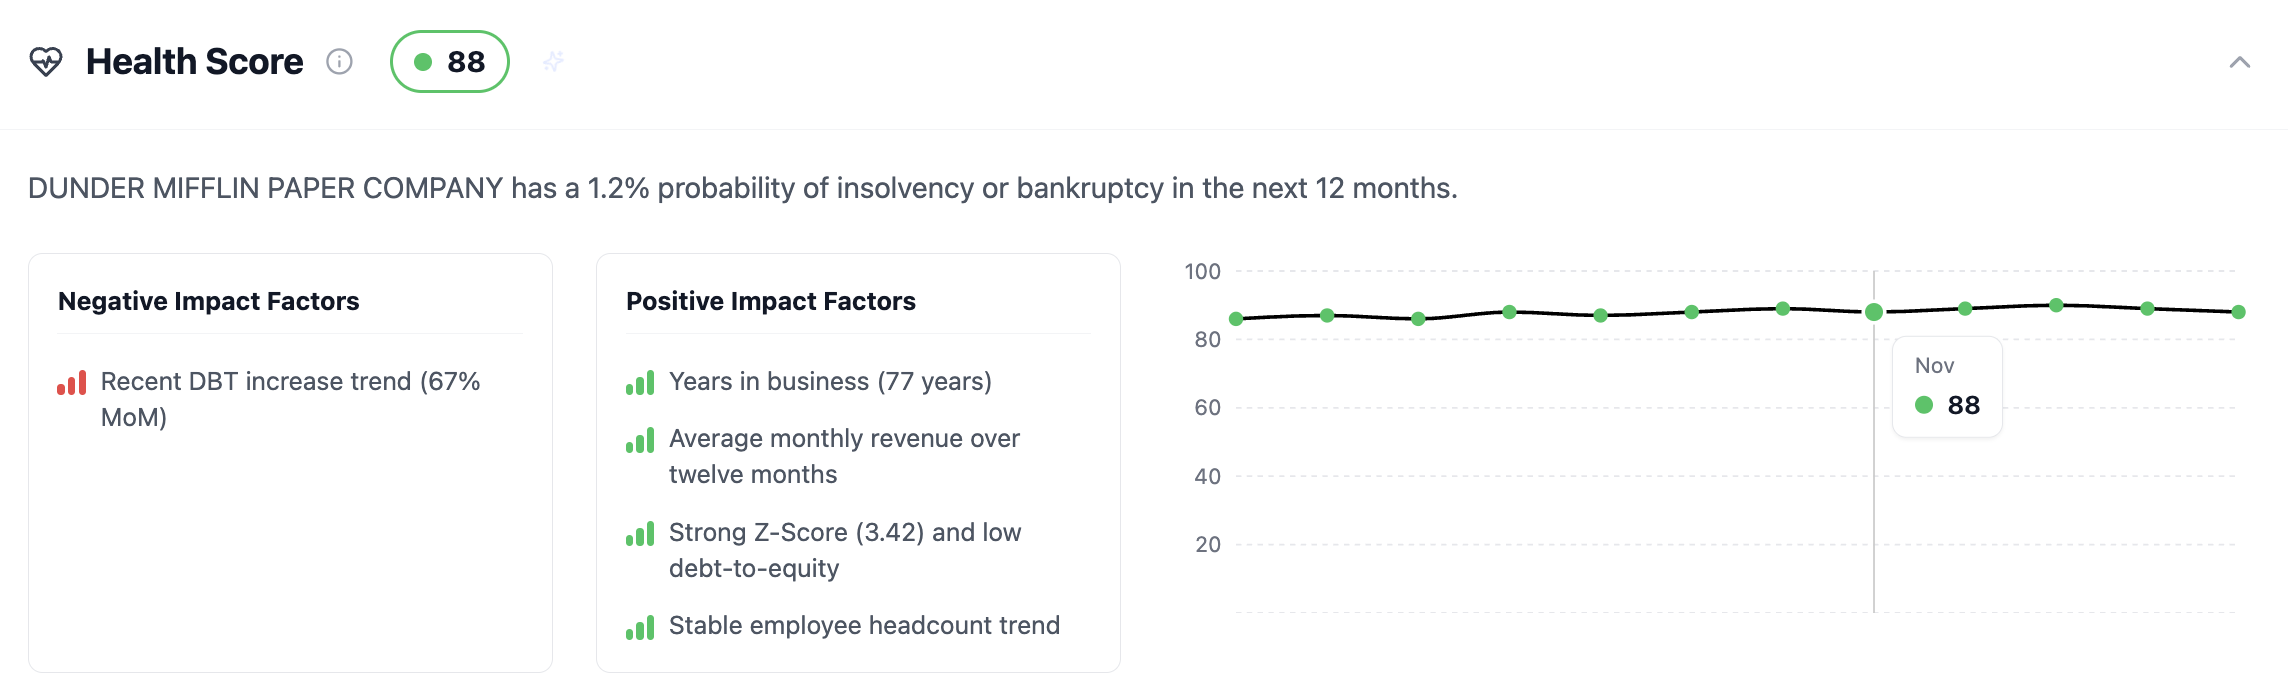
Health Score
The Health Score focuses specifically on financial stability and bankruptcy risk.
It estimates the likelihood that a company may become insolvent within the next 12 months.
What it considers:
Financial trends and ratios
Company longevity
Revenue and size indicators
Structural risk signals
Stability metrics over time
What you’ll see:
Probability of bankruptcy or insolvency
Positive and negative contributing factors
Trend over time
How to use it:
Validate long-term risk exposure
Monitor existing customers for deterioration
Identify early warning signs before issues surface
Think of Health Score as your “will they survive?” signal.
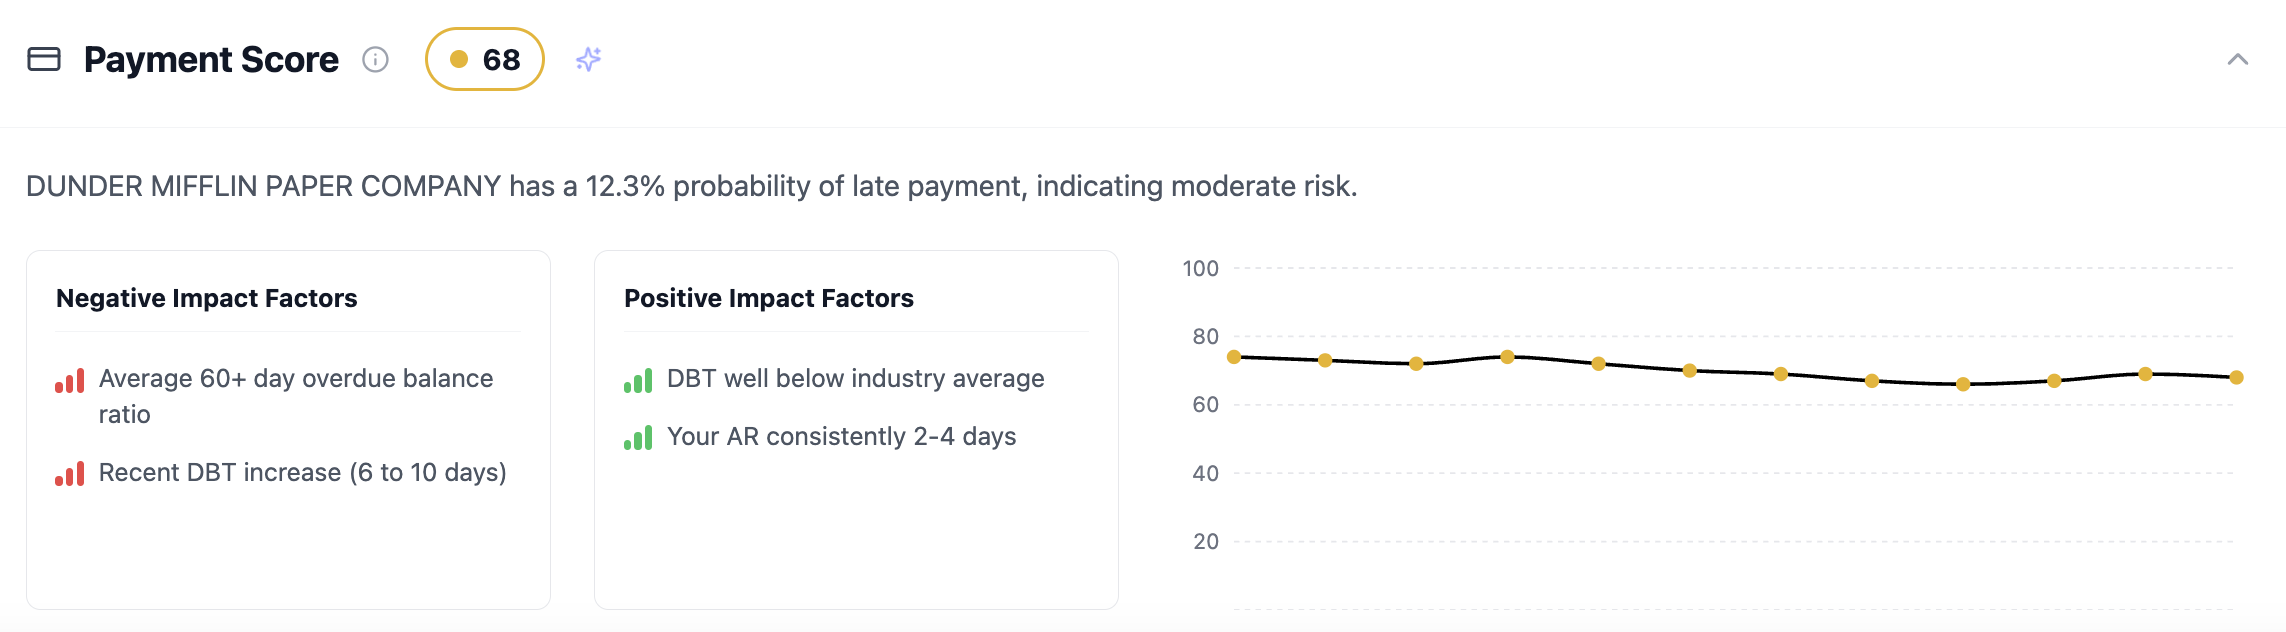
Payment Score
The Payment Score predicts how likely a company is to pay late or miss payments.
It focuses on short-term behavior rather than long-term viability.
What it considers:
Trade payment data
Days beyond terms (DBT)
Changes in payment patterns
Industry payment benchmarks
What you’ll see:
Probability of late payment
Payment trend over time
Key drivers impacting behavior
How to use it:
Set credit terms and limits
Prioritize collections
Flag accounts that may become slow payers
Think of Payment Score as your “will they pay you on time?” signal.
Prediction Accuracy
Traditional credit scores rely on static financials and lagging data. By the time risk shows up, it’s often too late.
Our models combine real-time signals, broader datasets, and machine learning trained on actual outcomes to surface risk earlier and more reliably.
What's Different
Beyond financials: We incorporate payment behavior, operational signals, news, and workforce trends.
Real-time vs. point-in-time: Traditional scores update periodically. Our models continuously evaluate changes, so you see risk as it develops, not months later.
Built for private companies: Our model works with or without financials. Our financial statement spreader is available to add additional insight when available.
Outcome-based training: Models are trained on real-world events like bankruptcies and payment deterioration, not just proxy variables.
Our Measurements
We evaluate models over a 12-month probability of default (PD) window using industry-standard metrics:
AUC (Area Under the Curve): Measures how well the model separates low-risk vs. high-risk accounts. Our AUC: ~0.85 vs. ~0.70–0.83 benchmarks
False Positives (Type II Error). Measures how often safe accounts are incorrectly flagged as risky. Our model produces fewer false positives than benchmarks.
Confidence Indicators
Our models prioritize the most predictive data available. In some cases, data may be limited. When that happens, scores may include confidence indicators to help you understand how much data supports the prediction.
As with any model:
Scores are directional, not absolute
They improve decision consistency across your team
They reduce reliance on gut feel and manual research
Scout, Our AI Assistant
When in doubt, ask Scout. Need more context on a score? Use Scout, our AI-powered assistant, to break down:
Why a score changed
What data is driving risk
How to interpret a specific company
Click the ✨ icon next to any score or start a chat in the bottom right corner.
Questions? Email support@creditpulse.com for support.